Agency administrators can monitor their agency's Public API activity directly within Momentum AMS. The Public API Usage page provides information about request volume, billable usage, endpoints, users and applications, response performance, and API errors.
Use these tools to understand how your integrations are using the Momentum Public API and to monitor usage against your API plan.
How to Access Public API Usage
To view your agency's Public API usage:
- Sign in to Momentum AMS as the Agency Owner or Administrator.
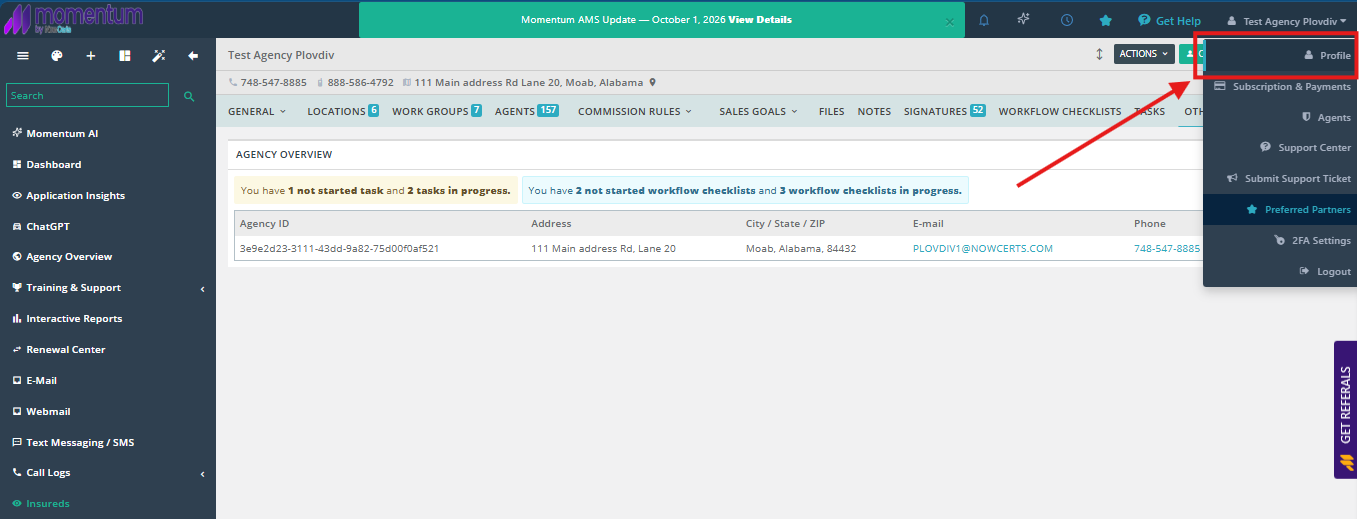
- Select your Agency Name in the upper-right corner.
- Select Profile to open the Agency Profile.
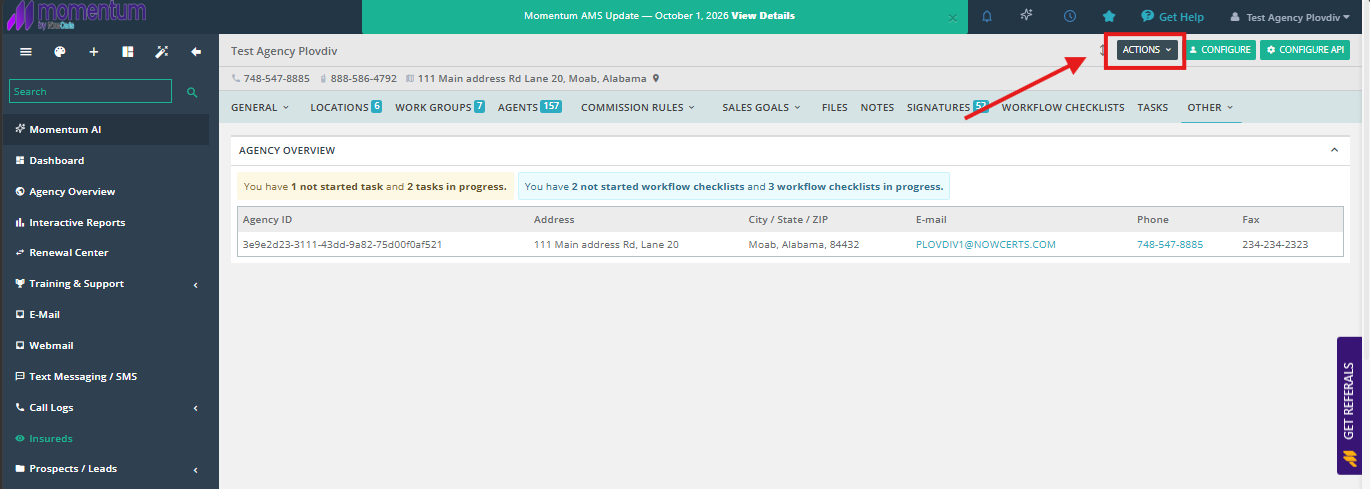
- From the Agency Profile, select Actions.
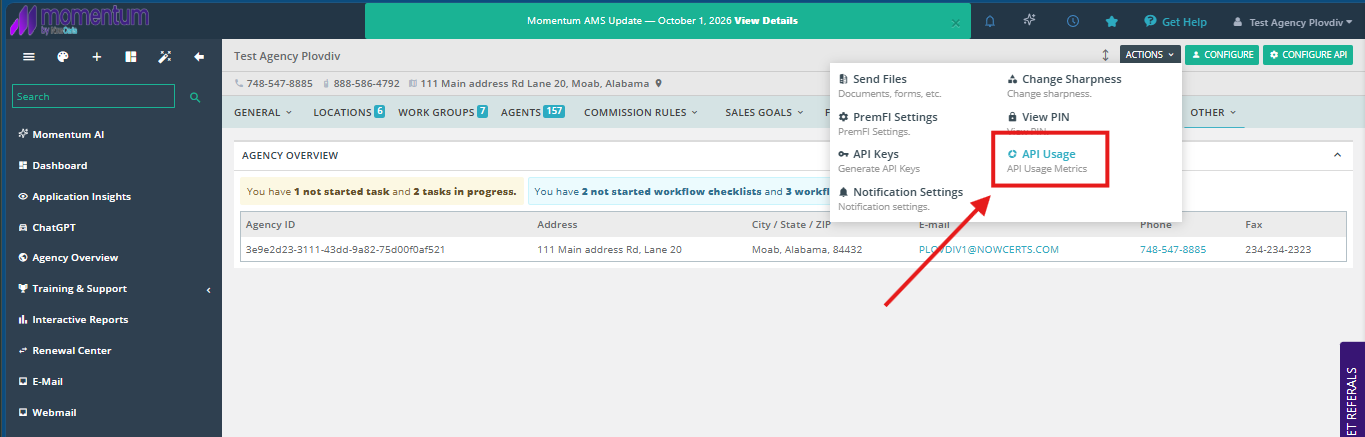
- Select API Usage.
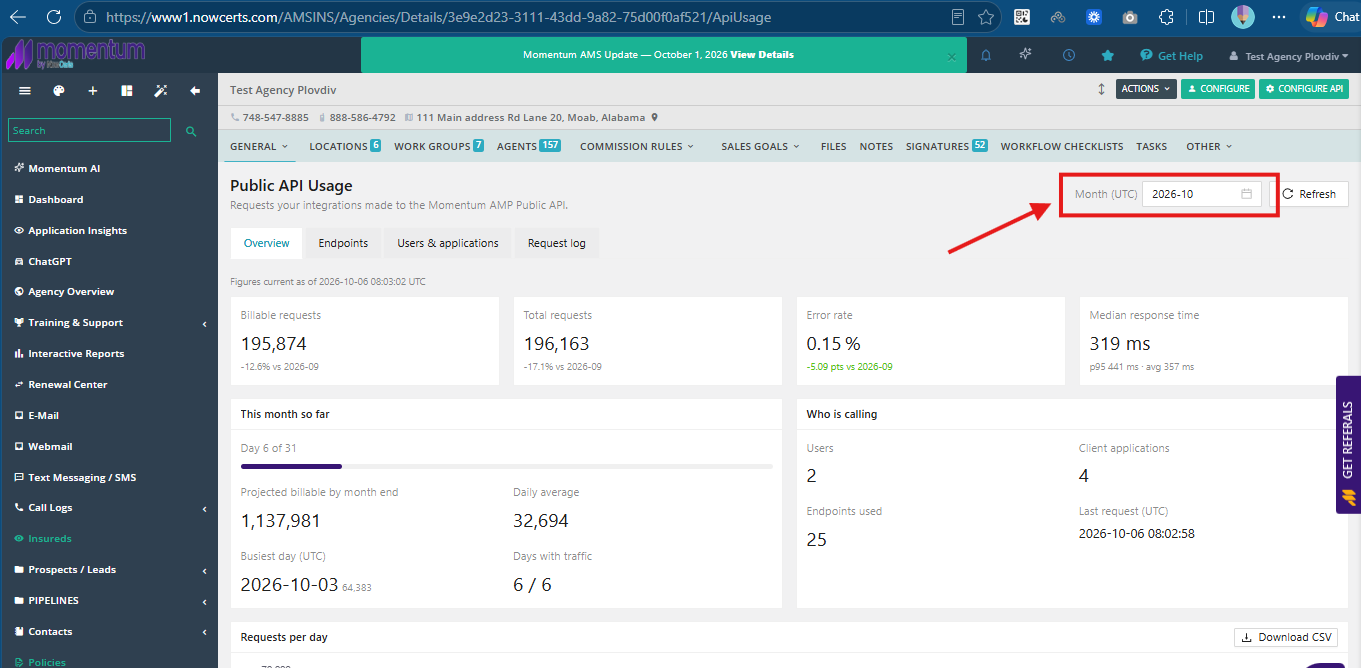
The Public API Usage page opens on the Overview tab and initially displays information for the current calendar month.
Selecting the Reporting Month
At the top of the Public API Usage page, use the Month (UTC) field to select the reporting month you want to review.
The selected month applies to all Public API Usage tabs.
You can also select Refresh to reload the information. The page displays when the figures were last updated.
Understanding the Public API Usage Tabs
The Public API Usage page contains four primary tabs:
- Overview – Monitor monthly request volume, projected usage, performance, and errors.
- Endpoints – See which API endpoints are receiving requests and identify endpoint-specific errors or performance issues.
- Users & Applications – Identify the users and applications generating API traffic.
- Request Log – Review individual API requests and troubleshoot specific failures.
Overview
The Overview tab provides a high-level picture of your agency's API activity for the selected month.
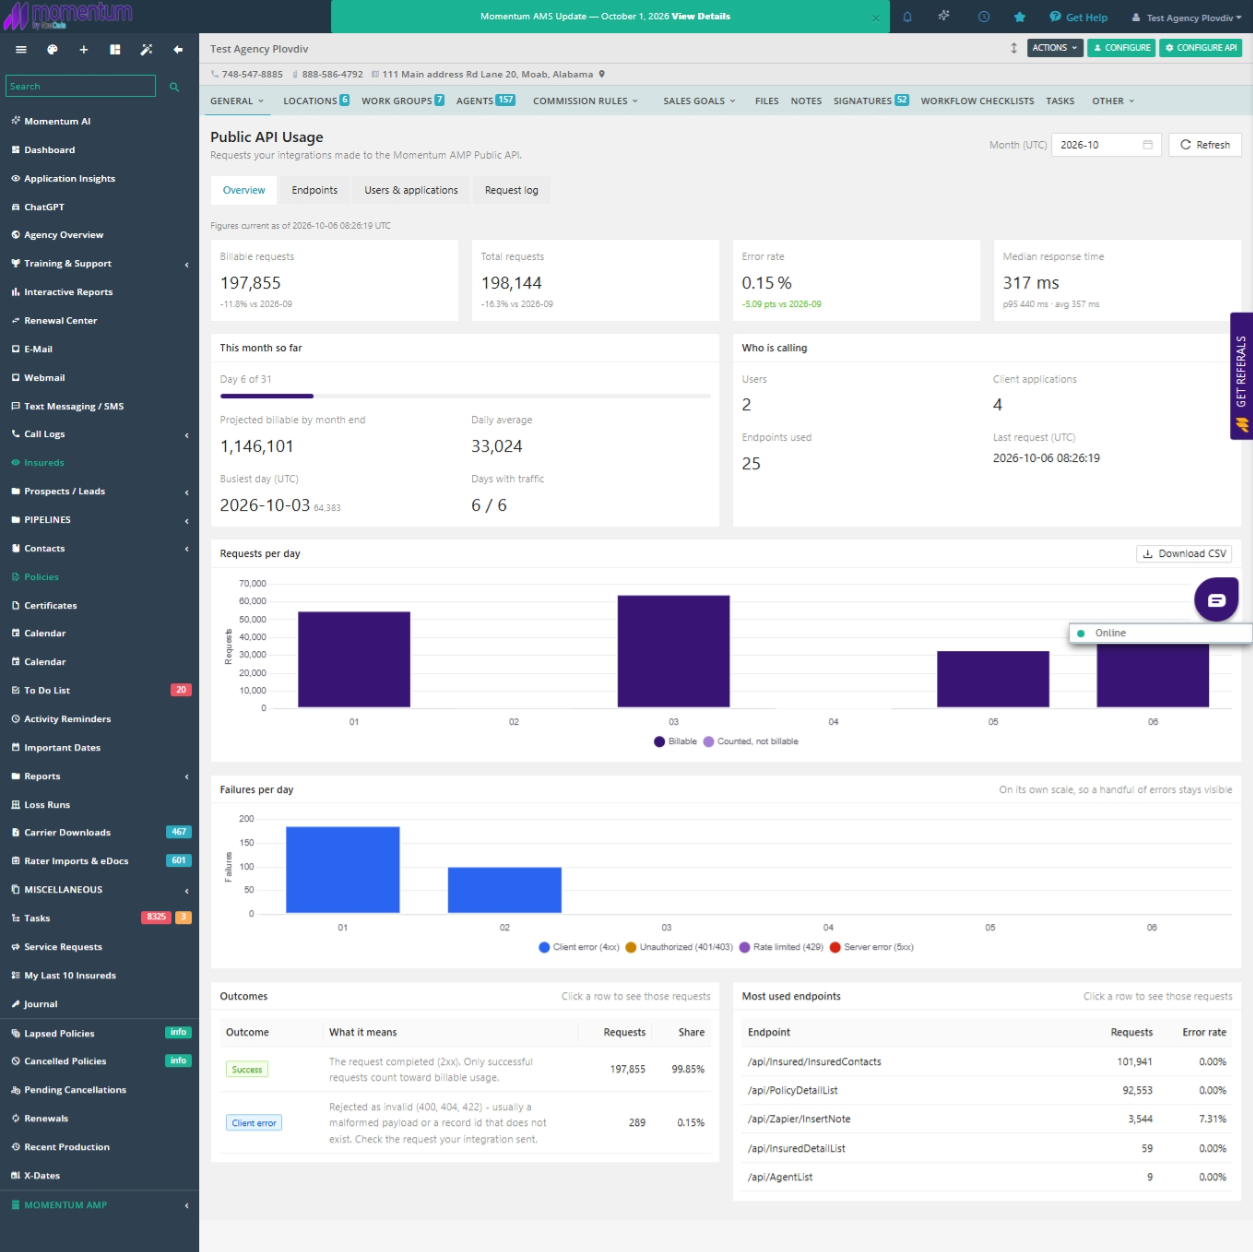
Billable Requests
Billable Requests shows the requests that count toward your agency's API plan during the selected month.
This is the primary number to use when monitoring usage against your plan.
Total Requests
Total Requests includes all requests received, whether they are billable or non-billable.
Because unsuccessful requests generally do not count toward the plan, the Total Requests number may be higher than the Billable Requests number.
Error Rate
The Error Rate shows the percentage of API requests that failed.
An increase in errors can help identify an integration that is sending invalid requests, experiencing authentication problems, or encountering another issue.
Median Response Time
Median Response Time provides a general measure of API response performance. It is provided for performance monitoring and does not determine whether a request is billable.
This Month So Far
The This Month So Far section includes information such as:
- Current day of the reporting month
- Projected billable requests by month end
- Daily request average
- Busiest day
- Number of days with API traffic
The Projected Billable figure can provide an early indication that your agency may exceed its current API plan tier.
Who Is Calling?
The Who Is Calling? section provides a quick overview of API activity, including:
- Number of users
- Number of client applications
- Number of endpoints being used
- Most recent API request
This can help confirm that expected integrations are active and identify unexpected API activity that may require additional review.
Requests and Failures by Day
Requests per Day
Use Requests per Day to review:
- Daily API request volume
- Billable and non-billable requests
- Unusual increases or spikes in activity
Select Download CSV when you need to export the information for additional review.
Failures per Day
Failures per Day helps identify when API requests began experiencing problems.
Failures are categorized by type, including:
- Client errors
- Unauthorized requests
- Rate-limited requests
- Server errors
This can be useful when determining when an integration began failing or when an unusual pattern of errors occurred.
Endpoints
The Endpoints tab shows the API paths used by your agency's integrations during the selected month.
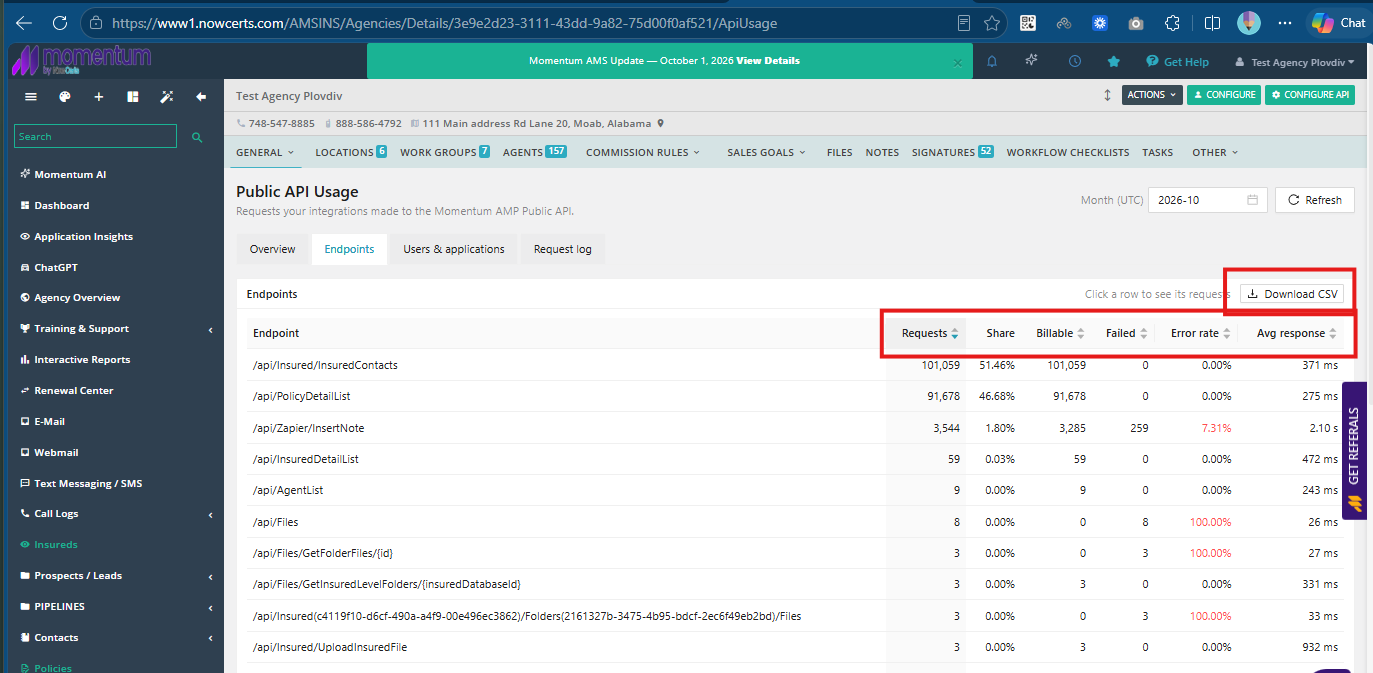
For each endpoint, you can review:
- Endpoint – The API path being called.
- Requests – Total requests to the endpoint for the selected month.
- Share – The endpoint's percentage of overall requests.
- Billable – Requests that count toward the API plan.
- Failed – Requests that did not succeed.
- Error Rate – The percentage of requests to the endpoint that failed.
- Avg Response – The average response time for the endpoint.
Select a column heading to sort the results.
You can also select an individual endpoint to review the requests associated with it.
Select Download CSV to export the endpoint list for further analysis.
When Is the Endpoints Tab Helpful?
Use the Endpoints tab when you need to determine:
- Which API endpoint is generating the most traffic
- Which endpoint has the highest error rate
- Whether one endpoint is responsible for an unexpected increase in API usage
- Whether requests to a particular endpoint are responding more slowly than expected
Users & Applications
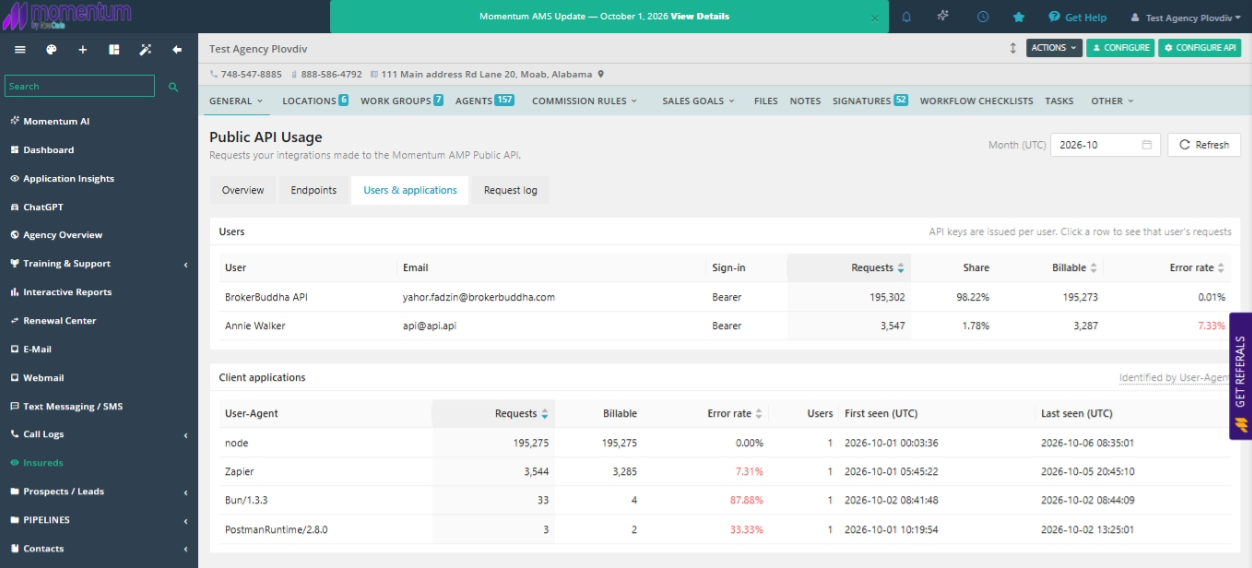
The Users & Applications tab helps identify who and what is generating your agency's API traffic.
Users
API keys are generated per user account. Each row in the Users section represents a specific user account under which API requests were executed.
Information includes:
- User / Email – The AMS user under which the requests were made.
- Sign-in – How the user authenticated.
- Requests / Share – Requests made by the user and their share of overall traffic.
- Billable – Requests from the user that count toward the plan.
- Error Rate – The percentage of the user's requests that failed.
Select a user to review the API request activity associated with that account.
Client Applications
The Client Applications section identifies the software or integration making API requests based on the User-Agent submitted with each request.
Examples can include tools or applications such as:
- Node.js
- Zapier
- Postman Runtime
For each client application, you can review:
- User-Agent
- Total requests
- Billable requests
- Error rate
- Number of API users
- First seen and last seen dates for the selected month
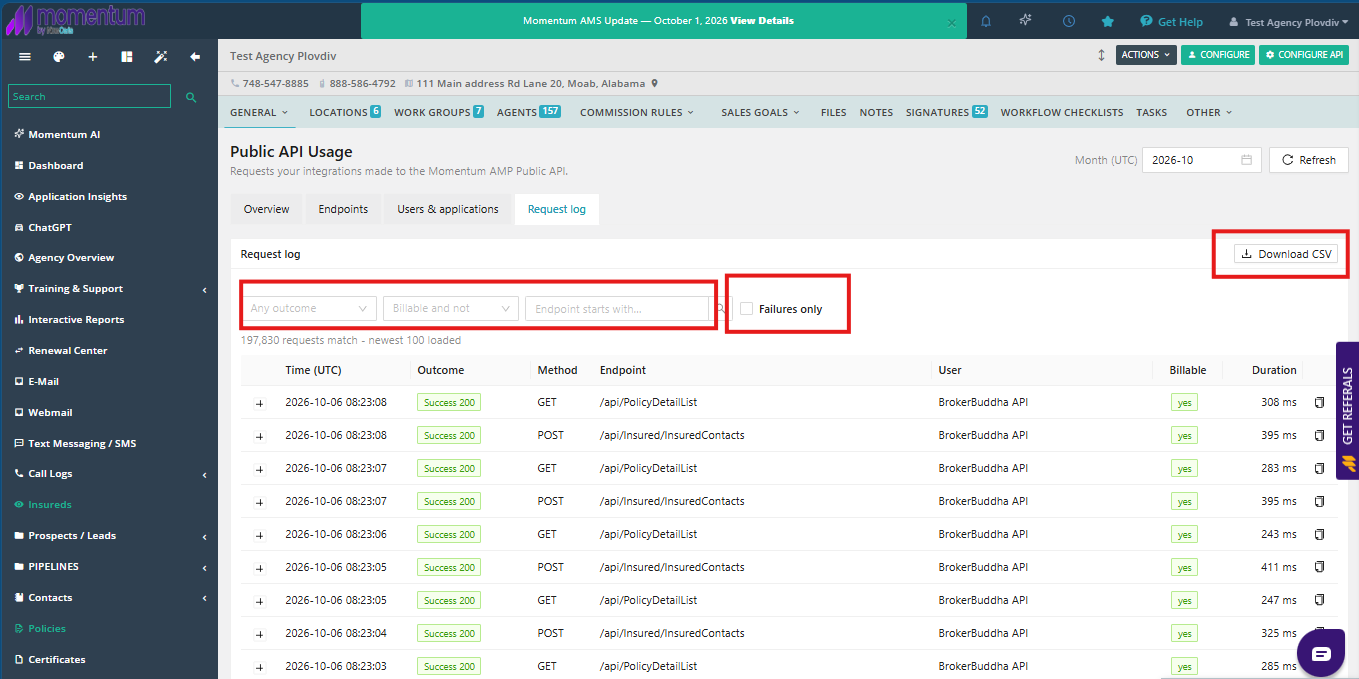
Request Log
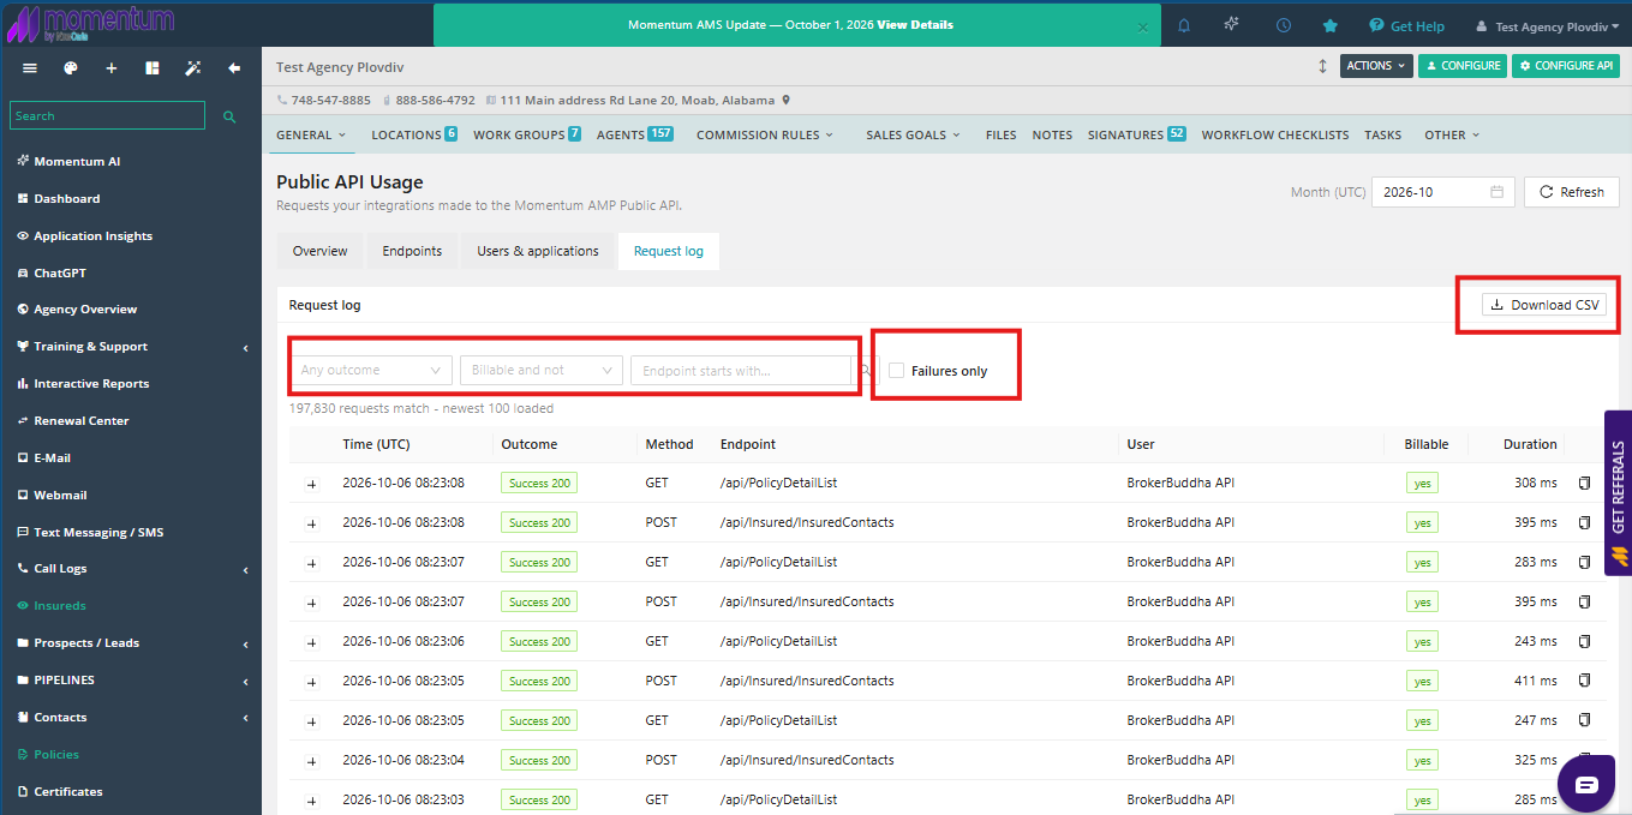
The Request Log provides a chronological audit trail of individual API calls, with the newest requests displayed first.
Use this area when you need to investigate a specific API request, confirm whether a request was billable, or troubleshoot failures.
Request Log Filters
You can filter the Request Log using:
- Outcome – Display requests with a specific outcome or any outcome.
- Billable – Display billable requests, non-billable requests, or both.
- Endpoint starts with... – Enter the beginning of an endpoint path to narrow the results.
- Failures Only – Hide successful requests and display only failures.
The Request Log also shows how many requests match the selected filters and how many of those requests are currently loaded.
Request Log Information
Each request can include:
- Time (UTC) – When the request was received.
- Outcome – The result and HTTP status code.
- Method – The HTTP method, such as GET or POST.
- Endpoint – The API path that was called.
- User – The API user who made the request.
- Billable – Whether the request counts toward the API plan.
- Duration – How long the request took.
Select the + at the beginning of a row to expand the request details.
You can also use the copy option to copy request information or select Download CSV to export the results.
Understanding Request Outcomes and Billing
Every API request is categorized based on its outcome. Under Momentum AMS API billing rules, only successful API requests count toward plan tier limits.
| Outcome | Typical Status Code | Billable? | What It Means |
|---|---|---|---|
| Success | 2xx | Yes | The request completed successfully. |
| Client Error | 400, 404, 422 | No | The request was rejected as invalid. Review the request sent by the integration. |
| Unauthorized | 401, 403 | No | The credentials or API key were rejected. |
| Rate Limited | 429 | No | Too many calls were made. The integration should slow down and retry. |
| Server Error | 5xx | No | A problem occurred on the Momentum AMS side. |
| Cancelled | — | No | The connection was terminated before the request completed. |
How API Requests Are Counted
When reviewing your API usage, keep the following counting rules in mind:
- Each HTTP request counts as one request, regardless of how many records are returned.
- For example, a single request that returns 100 records still counts as one request.
- A bulk insert counts as one request.
- If one integration task makes several separate HTTP calls, each call counts separately.
- Retries and server errors do not count.
- Overages are rounded up to full blocks of 10,000 requests.
Troubleshooting Common API Errors
400, 404, or 422 – Client Error
The request was rejected as invalid. This can occur because of information such as a malformed payload or a record ID that does not exist.
Review the request being sent by the integration.
401 or 403 – Unauthorized
The credentials or API key were rejected.
To review your agency's API keys, go to:
Agency Profile > Actions > API Keys
429 – Rate Limited
The integration is making too many calls. The current limit is 100 calls per endpoint.
The integration should slow down and retry the request.
5xx – Server Error
A problem occurred on the Momentum AMS side.
If the issue persists, contact integrations@momentumamp.com for assistance.
Monitoring Your API Plan Usage
Usage monitoring under tiered API plans begins October 15, 2026. Agencies can monitor usage against their plan limits directly from the Public API Usage page.
Automated threshold notifications are issued when API usage reaches:
- 80% of capacity
- 95% of capacity
- 100% of capacity
Use the Projected Billable amount on the Overview tab to help determine whether your agency is on track to exceed its current plan tier.
Common Questions
How can I tell if we're on track to exceed our API tier?
Go to:
Overview > This Month So Far > Projected Billable
Compare the projected billable request volume with the request volume included in your API plan.
How can I see which integration is using the most API requests?
Open Users & Applications and review the number of requests associated with each user and client application.
How can I investigate a sudden spike in API usage?
Start with Overview > Requests per Day to identify the day when the spike occurred.
Then use the Request Log and endpoint filters to investigate the requests that were made.
How can I find out why API requests are failing?
Open the Request Log and select Failures Only.
Review the HTTP status codes to help determine the cause:
- 401 / 403 – API key or credential issue
- 429 – Rate limit
- 400 / 404 / 422 – Invalid request data
What should I do if I see an unfamiliar user or application?
Review the activity under Users & Applications.
If the user or application should no longer have API access, review its API key under:
Agency Profile > Actions > API Keys
Why don't I see API usage from before the upgraded Public API?
Usage from the legacy API was not captured by Public API Usage reporting. Historical usage begins with the upgraded Public API.
Best Practices
- Review Billable Requests regularly to monitor usage against your API plan.
- Watch Projected Billable to identify potential overages before the end of the month.
- Investigate unexpected increases using Requests per Day, Endpoints, and the Request Log.
- Review Users & Applications periodically to confirm API access is coming from expected integrations.
- Use Failures Only in the Request Log when troubleshooting an integration.
- Remember that dates and times within Public API Usage are displayed in UTC.
Need Help?
For technical assistance or concerns related to the Momentum Public API, contact:
integrations@momentumamp.com
Additional resources:
- Momentum Public API FAQs
- Momentum API Documentation and Developer Portal
- Momentum API Plans and Pricing
Summary
The Public API Usage page gives agency administrators visibility into how integrations are using the Momentum AMS Public API.
Start with the Overview tab to monitor monthly and projected billable usage. Use Endpoints and Users & Applications to determine where API traffic is coming from, and use the Request Log when you need to investigate individual requests or troubleshoot errors.
Together, these tools provide a central location for monitoring API activity, usage, performance, and integration health.
Was this article helpful?
That’s Great!
Thank you for your feedback
Sorry! We couldn't be helpful
Thank you for your feedback
Feedback sent
We appreciate your effort and will try to fix the article